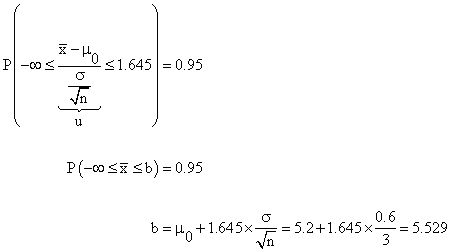
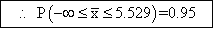
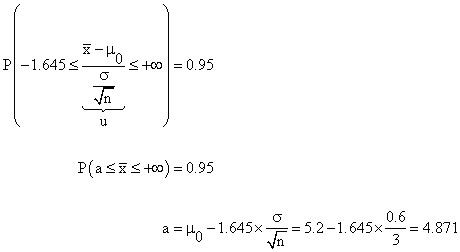
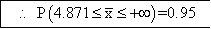
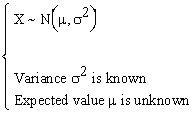
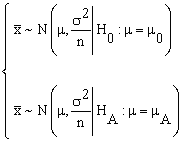
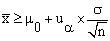
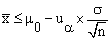
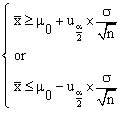
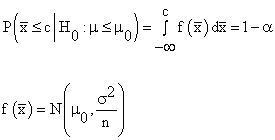
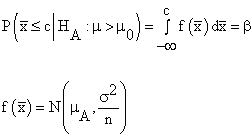
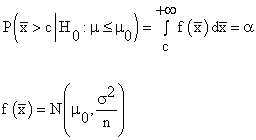
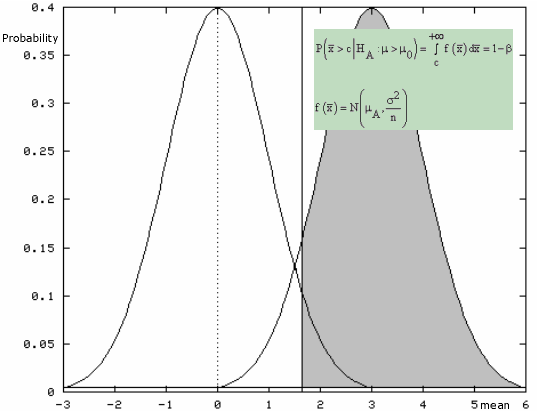
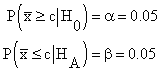
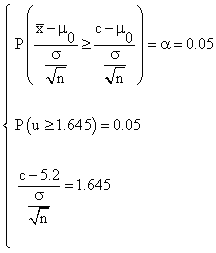
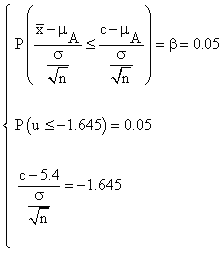
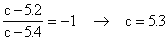
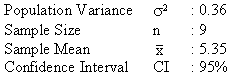
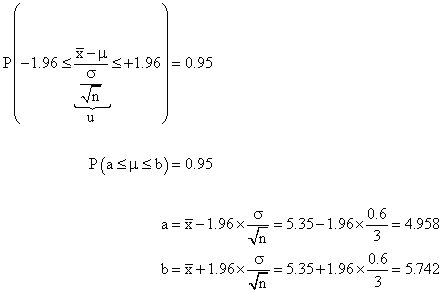
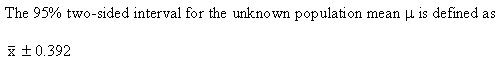
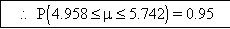
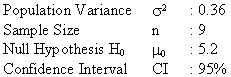
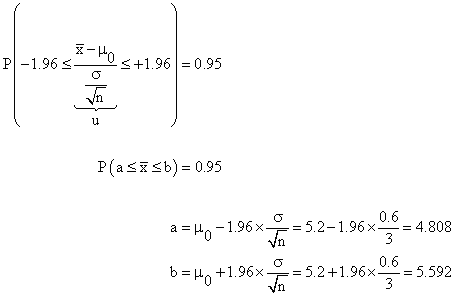
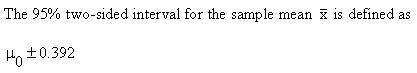
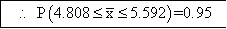
Xycoon logo
Hypothesis Testing
Home    Site Map    Site Search    Xycoon College    Free Online Software    
horizontal divider
vertical whitespace

Hypothesis Testing - Statistical Test of Population Mean with known Variance - Theory & Examples

[Home] [Introduction] [Mean (var. known)] [Variance] [Mean (var. unknown)] [Pop. Proportion]

Theory: [Population] [Sample] [Overview]
Examples: [Critical Value] [P-Value] [Type II Error] [Sample size] [Confidence Intervals for Population Mean] [Confidence Intervals for Sample Mean]


Statistical Hypothesis: Testing Mean with known Variance -- Population

Population distribution:

Variance is known, expected value is unknown

[top]


Statistical Hypothesis: Testing Mean with known Variance -- Sample

Sample statistics:

sample mean

Sample distribution:

sample distribution of mean

[top]


Statistical Hypothesis: Testing Mean with known Variance -- Critical Region

Table overview:

Null Hypotesis Alternative Hypotesis Critical Region

one-sided null hypothesis

one-sided alternative hypothesis

critical region of one-sided test

one-sided null hypothesis

one-sided alternative hypothesis

critical region of one-sided test

two-sided null hypothesis

two-sided alternative hypothesis

critical region of two-sided test

one-sided null hypothesis

one-sided alternative hypothesis

Accept H0 Correct
Probability p = 1 - α
Type II Error
Probability p = β
Reject H0 Type I Error
Probability p = α
Correct
Probability p= 1 - β

one-sided null hypothesis

one-sided alternative hypothesis

Accept H0

probability of accepting the null hypothesis when it is true

probability of accepting the null hypothesis when it is false (= type II or beta error)

Reject H0

probability of rejecting the null hypothesis when it is true (= type I or alfa error)

probability of rejecting the null hypothesis when it is false

shaded area = probability of (correctly) accepting the null hypothesis when it is true = 1 - type I error

shaded area = probability of accepting the null hypothesis when it is false = type II error = beta

shaded area = probability of rejecting the null hypothesis when it is true = type I error = alfa

shaded area = probability of (correctly) rejecting the null hypothesis when it is false = 1 - type II error

[top]


Statistical Hypothesis: Testing Mean with known Variance -- Example 1: Critical Value (Region)

Free Statistics Software (Calculator)

use this Software (Calculator) to solve this problem

Problem

problem: find the critical value

Solution

solution: the probability that the null hypothesis is rejected when it is true is equal to alfa. This equation is written in the form of an integral

It is known that if

we introduce an auxiliary variable u

then it follows that

u has a standard normal distribution.

now the alfa probability can be rewritten

the mean is smaller than the critical value

Conclusion

conclusion: do not reject the null hypothesis

[top]


Statistical Hypothesis: Testing Mean with known Variance -- Example 2: P-value (probability)

Free Statistics Software (Calculator)

use this Software (Calculator) to solve this problem

Problem

problem: find the p-value

Solution

solution: we know that the sample mean is normally distributed

the sample mean is standardized

we use the standard normal distribution to compute the p-value.

Conclusion

since the p-value (= 0.22) is larger than alfa (= 0.05) there is no reason to reject the null hypothesis

[top]


Statistical Hypothesis: Testing Mean with known Variance -- Example 3: Type II Error

Free Statistics Software (Calculator)

use this Software (Calculator) to solve this problem

Problem

problem: find the type II error (= beta)

Solution

solution: the probability that the null hypothesis is rejected when it is false is equal to 1 - beta

the critical value is substituted

beta = 0.74.

Conclusion

conclusion: the type II error (beta) is 74%

[top]


Statistical Hypothesis: Testing Mean with known Variance -- Example 4: Sample size

Free Statistics Software (Calculator)

use this Software (Calculator) to solve this problem

Problem

Solution (method 1)

.

.

.

Conclusion

Solution (method 2)

Conclusion

[top]


Statistical Hypothesis: Testing Mean with known Variance -- Example 5: Confidence Intervals for Population Mean

Free Statistics Software (Calculator)

use this Software (Calculator) to solve this problem

Problem

Two-sided confidence interval

.

Right one-sided confidence interval

Left one-sided confidence interval

[top]


Statistical Hypothesis: Testing Mean with known Variance -- Example 6: Confidence Intervals for Sample Mean

Free Statistics Software (Calculator)

use this Software (Calculator) to solve this problem

Problem

Two-sided confidence interval

.

Right one-sided confidence interval

Left one-sided confidence interval

[top]


vertical whitespace


Home
Introduction
Mean (var. known)
Variance
Mean (var. unknown)
Pop. Proportion
horizontal divider
NEWS FEED from BBC News : Statistical Research
Half city's youth 'take cocaine'More than 50% of young people in Liverpool admit to having taken cocaine, a new report claims.
Paediatricians' GMC case delayedThe General Medical Council wins a delay in an investigation into the work of paediatrician David Southall allowing it to assess new evidence.
Adults with autism to be auditedFor the first time the government is to calculate the number of adults with autism in England.
Economic data 'credibility boost'Scotland could get an international "credibility boost" by introducing a new measure of Gross Domestic Product, a report says.
Cod fall may speed 'toxic tide'Declining fish stocks could be partially responsible for algal blooms in parts of the oceans, researchers find.
Green movement forgets its politicsWhy climate campaigners should stop trying to persuade people into lifestyle changes and start dealing with the politics.
Taking the pulse of the economyAt times of economic volatility, sentiment surveys are headline news. But is it really possible to measure the feel-good factor accurately?
Targets 'drive out head teachers'School leaders are being driven out of the profession by "pernicious systems of accountability", head teachers say.
Poland entices its workers homeThere are signs that many Poles who migrated for better paid jobs abroad have gone home. Two returnees tell their stories.
India warned over heart diseaseIndia will account for 60% of heart disease cases worldwide within two years, says a new research.
Recorded crime decreases by 12%Recorded crime in England and Wales fell by 12% in the last three months of 2007, Home Office figures show.
What if we all walked to work?It's Walk to Work Day, but what would Britain be like if we all passed up road and rail for the humble pavement? Steve Tomkins ponders the potential consequences of letting our legs do all the work.
Probation Service 'faces crisis'The Probation Service faces a crisis of shrinking budgets and a shortage of frontline staff, says a new report.
Scottish growth outperforming UKLatest Scottish government figures show the Scottish economy outperforming the rest of the UK in Q4 2007.
Rural towns new 'creative hubs'Rural towns are the fastest growing centres of creativity, according to a new business league table.
Breast checks 'benefit over-70s'Women should be screened for breast cancer up to the age of 75, a study of over 860,000 women suggests.
Younger children disciplined lessAcademics say their research confirms the belief that parents are often tougher on their oldest children.
Ageing issue 'ticking time bomb'A new group is set up to study the financial implications of the UK population living longer.
'Drop' in drink-fuelled violenceA study suggests community projects to cut binge drinking have led to a 10% fall in violent crime in Glasgow.
China 'now top carbon polluter'China has already overtaken the US as the world's biggest polluter, according to a new report by US scientists.
horizontal divider

© 2000-2006 - Office for Research, Development, and Education (called ORDE) - All rights reserved. This website is published by ORDE and owned by Resa R&D. This includes: html content, graphical illustrations (gif, jpg, and png files), computer software, online or electronic documentation, associated media, and printed materials. All Photographs (jpg files) are the property of Corel Corporation, Microsoft and their licensors. ORDE has acquired a non-transferable license to use these pictures in this website.
The free use of the scientific content in this website is granted for non commercial use only. In any case, the source (url) should always be clearly displayed. Under no circumstances are you allowed to reproduce, copy or redistribute the design, layout, or any content of this website (for commercial use) including any materials contained herein without the express written permission of ORDE.

Information provided on this web site is provided "AS IS" without warranty of any kind, either express or implied, including, without limitation, warranties of merchantability, fitness for a particular purpose, and noninfringement. ORDE uses reasonable efforts to include accurate and timely information and periodically updates the information without notice. However, ORDE makes no warranties or representations as to the accuracy or completeness of such information, and it assumes no liability or responsibility for errors or omissions in the content of this web site. Your use of this web site is AT YOUR OWN RISK. Under no circumstances and under no legal theory shall ORDE be liable to you or any other person for any direct, indirect, special, incidental, exemplary, or consequential damages arising from your access to, or use of, this web site.

Contributions and Scientific Research: Prof. Dr. E. Borghers, Prof. Dr. P. Wessa
Please, cite this website when used in publications: Xycoon (or Authors), Statistics - Econometrics - Forecasting (Title), Office for Research Development and Education (Publisher), http://www.xycoon.com/ (URL), (access or printout date).
Facilities, development, and design: Office for Research, Development, and Education

Comments, Feedback, Bugs, Errors | Privacy Policy Web Awards

This website is kindly sponsored by: Bandwidth Control | Time Series, Statistics Resources, and Statistics Software | Computer schools and technology degrees